$CTRL Bounce & Break Out Catalysts
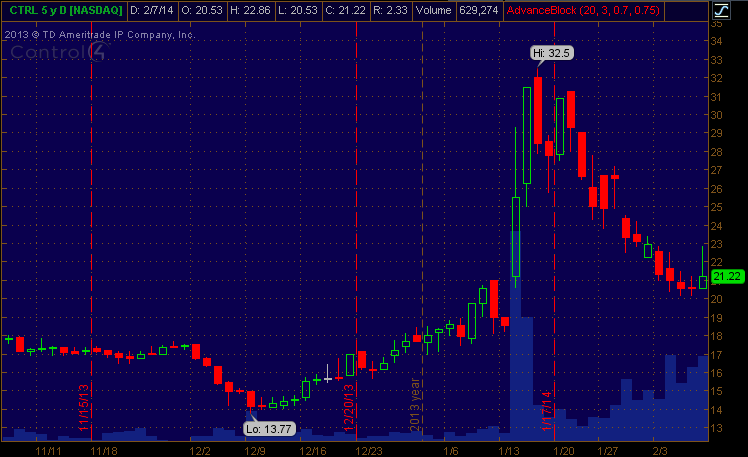 On 2/6/14 I traded CTRL on a Timothy Sykes trade alert! I personally do not know what news is behind this stock… All I saw was the patterns, specially the support and resistance levels. I was waiting until it broke $21.51 at which is the second red bar resistance level back from 2/6. Right once it punched through it surged within a 5 minute period almost to $23. I believe I played this pretty damn well specially with only a 250 share position!
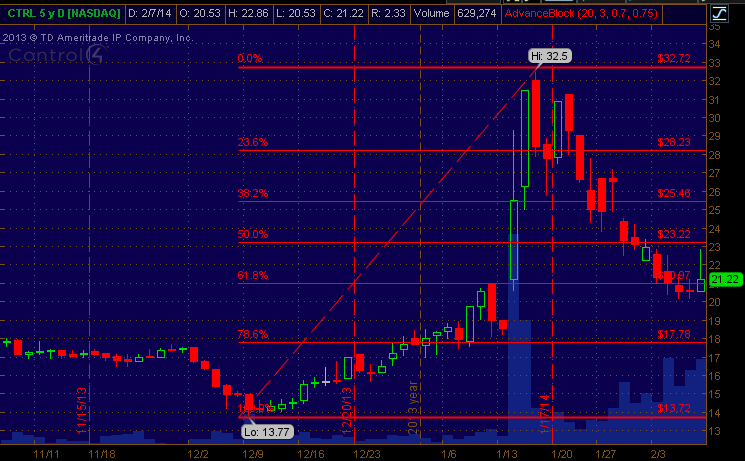
Now I didn’t play this like a pro or anything, because I wouldn’t know! I don’t take full credit at all at noticing this pattern, but out of all the plays that T.S sent out I couldn’t keep my eyes off this one and fully put my attention to it. Why? Because of the many multiple break outs that could and did happen. The first breakout when the bounce began was a Fibonacci retracement breakout at $21.00, but on top of that it was a break out into a round number and a powerful one at that, it was also support and resistance a few times in the past and had a break out through it before! So with the bounce, the retracement breakout, the former support and the large volume… I don’t think it could have gotten really any better!
 Although I’m just now learning more about how Fibonacci works on charting, I’ve known about the mathematical formula for many many years now and notice it every where! So it’s absolutely amazing seeing this unveil itself in front of me whilst I played it!
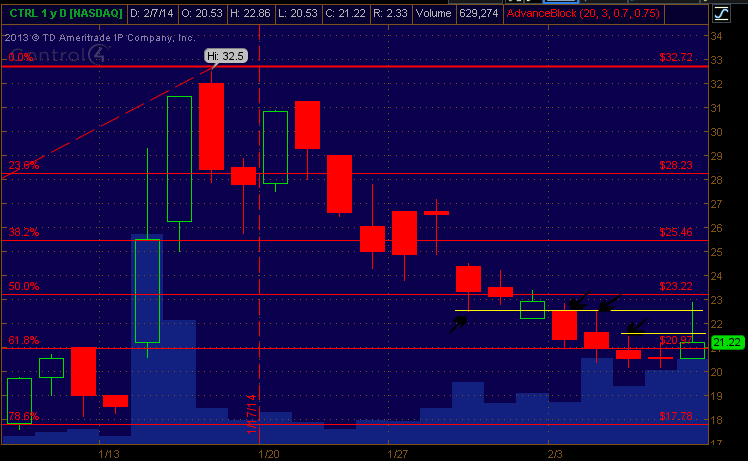 Here you can see a zoomed in picture of several break out and resistant levels! I got in at $21.51 which is that first arrow mark on the left! When I saw it break out I had a feeling it wouldn’t spike any further then second yellow line up and if it did it most likely wouldn’t break that %50 Fibonacci retracement line! So I got out immediately once I saw it surge into the twos and by the time I did it was $22.50!
The more I review technical analyzing and merging them with other forms of “break out” and “break down” data the more I see that when all these merge onto themselves a self fulfilling prophecy occurs… But what I find amazing about the Fibonacci sequence in stock trading is what the late great W.D Gann said about it while researching it! I’ve not come to noticing the findings of W.D Gann myself (totally) just yet… but what I do know is there is a very interesting curve to reality… something that has provoked mystery schools and religion through out the age of man.
I believe it can go as far as alignment of the planets in our solar system which also influence this vibrational frequency, I also believe that every living thing on the face of the Earth reacts to this vibrational frequency helping to fulfill a matter of this frequency that we as humans will never fully understand. I could bring up the beliefs of those that believe in free will and divine intervention in all things… What Mr. Gann found was that even through the manipulation of stocks these patterns and the Laws of Vibration still finds itself inside these patterns… So if stocks can be manipulated, and still resonant with these vibrational frequency (Fibonacci Sequence) then we can say for certain and zoom out to the bigger picture and notice that even economic crashes can be predicted and they could come no matter what is actually happening… the happening, is just a solution to resolve back into harmony of the frequency!
So when it comes down to it…. does Fundamentals or news or sec filings really matter….? Absolutely! From the point of a frequency such as this… the frequency is being harmonized by those who participate in purchasing or selling the stock because of SEC filings and Fundamentals and news (even pump n dumps)…. But for those who can see past this… Well you could possibly have an edge using the predictable movements to play the stock off just that… the predictable harmonizing influences and vibration of the market being created!
Of course right now… I wouldn’t risk it like Mr. Gann would on some stocks… but I can see possibly how this could work… and still might for myself (maybe even you?)! From Gann’s perspective for example pump n dumps have their patterns to play out as well… my big question is still… how can one really understand this like he did? Well I guess that’s why I’m researching him… to find out! But I thought I’d post some of his writings that he did in a periodical and you can read with your own eyes… these words from Mr. Gann himself.
I soon began to note the periodical recurrence of the rise and fall in stocks and commodities. This led me to conclude that natural law was the basis of market movements. I then decided to devote ten years of my life to the study of natural law as applicable to the speculative markets and to devote my best energies toward making speculation a profitable profession.
After exhaustive researches and investigations of the known sciences, I discovered that the Law of Vibration enabled me to accurately determine the exact points to which stocks or commodities should rise and fall within a given time. The working out of this law determines the cause and predicts the effect long before the Street is aware either. Most speculators can testify to the fact that it is looking at the effect and ignoring the cause that has produced their losses ………
In order to test out the efficiency of my idea I have not only put in years of labor in the regular way, but I spent nine months working night and day in the Astor Library of New York and in the British Museum of London, going over the records of stock transactions as far back as 1820.
I have incidentally examined the manipulations of Jay Gould, Daniel Drew, Commodore Vanderbilt, and all the other important Wall Street manipulators from that time to the present day.
I have examined every quotation of Union Pacific prior to and from the time of E. H. Harriman’s securing control, and can say that of all the manipulations in the history of Wall Street, Mr. Harriman’s was the most masterly. The figures show that, whether unconsciously or not, Mr. Harriman worked strictly in accordance with natural law.”
– W.D Gann
So to end it, I guess I’m going to be expanding my break outs farther past just what Tim teaches… after looking at many different graphs that he has played they all showed up the same… they have resistant lines and support lines from the Fibonacci retracement lines… they seem to fill the middle of what Tim teaches when looking for these types of things! I believe that Tim has just internalize his patterns and can feel the movement… For someone like me, additional indicators is absolutely a blessing to help me “feel” my way in the dark for now!
-Griffith Hawk